Labeling pie charts without collisions
Recently at work, I’ve been using Chart.js to create pie/donut charts. We really wanted the labels to be shown around the outside of the chart, next to each segment. Chart.js doesn’t do this out of the box, so one of the only solutions I found was the plugin Chart.PieceLabel.js. This was a great start, but I found that if the chart segments were too small, the labels would overlap and be unreadable, or it would only show one of them. I decided to challenge myself with making my own plugin that would handle overlaps/collisions more gracefully.
Since it can avoid the collision issue, PieceLabel went with the approach of finding the most accurate position to place the text along the outside, finding the middle between the start and end angles of each segment and calculating the X/Y coordinates from there. Something like this:
const angle = segment.startAngle +
  ((segment.endAngle - segment.startAngle) / 2);

const x = chart.x + (chart.outerRadius * Math.cos(angle));
const y = chart.y + (chart.outerRadius * Math.sin(angle));
Now there are probably many solutions to this, and I’m not the best at maths, so I decided to keep it fairly simple. So instead I find a range of coordinates along the chart’s circumference that would never collide with each other when text is drawn along a single line.

Then we would find the center angle of each segment and pair each one with the set of closest coordinates in the list. This way there could be no collisions, as when a point is taken it can’t be used by another segment/label.
It’s less accurate than the “segment center” technique, but seems worth it for having all labels on screen. There’s also the possibility you would run out of points, but with the data we are dealing with at work (maybe 2-5 segments) that’s not really an issue. We’re much more likely to have the situation where two small segments are close to each other and the labels would overlap.
Knowing the circle’s radius from Chart.js and that you could work out X/Y from the angle, my first attempt was split the circle into equal slices and loop through them, adding the point to an array whenever the Y position moves past the previous one plus the font size.
const points = [];
const resolution = 48;
const fontSize = 14;
let lastY = 0;

for (let i = 0; i < resolution; ++i) {
  const angle = Math.radians(i * (360 / resolution)) - Math.radians(90);
  const x = chart.x + (chart.outerRadius * Math.cos(angle));
  const y = chart.y + (chart.outerRadius * Math.sin(angle));

  if (lastY - y > fontSize || y - lastY > fontSize) {
    points.push({ x, y, angle });
    lastY = y;
  }
}
This creates something like this:
You can see it’s not symmetrical, which can be annoying if you had equal segments. It also feels a bit hacky having to generate (in this example) 48 points of interest, and only select 25 of them.
I took a second go at it, this time using line intersection. The idea is that you could draw an invisible horizontal line across the circle from the top and increment it down by the font size. At each iteration you can calculate the two points where the line intersects the radius of the circle, using the Power of Google and Stack Overflow.
while (n < endY) {
  const intersection = intersectCircleLine(circle, line);

  for (let i = 0; i < intersection.length; ++i) {
    const point = intersection[i];
    const angle = getAngle(view, point);

    points.push({
      x: point.x,
      y: point.y,
      angle,
    });
  }

  n += fontSize;
  line.p1.y = n;
  line.p2.y = n;
}
This creates something like this, much better!

The next step is to match each label to a point in the array. This can be done just by finding the center angle of each segment, then finding the closest angle in the points array. After a point is assigned, it’s marked as “taken” so it cannot be used again.
I found it difficult to get the labels in the correct order, closest to their segments, when a collision occurred. For example, if a point was taken, the next label had to be positioned further away, but when you actually look at the chart these positions should really be swapped. I briefly tried swapping them, which was a big pain, so came to the much simpler conclusion of assigning labels after the points have been found, in the order in which the segments appear.
Another important aspect was correctly assigning textBaseline and textAlign based on the label’s position around the circle. This ensures the text is drawn away from the circle in the right direction. I compare the point’s coordinates to the centre of the chart to decide this.
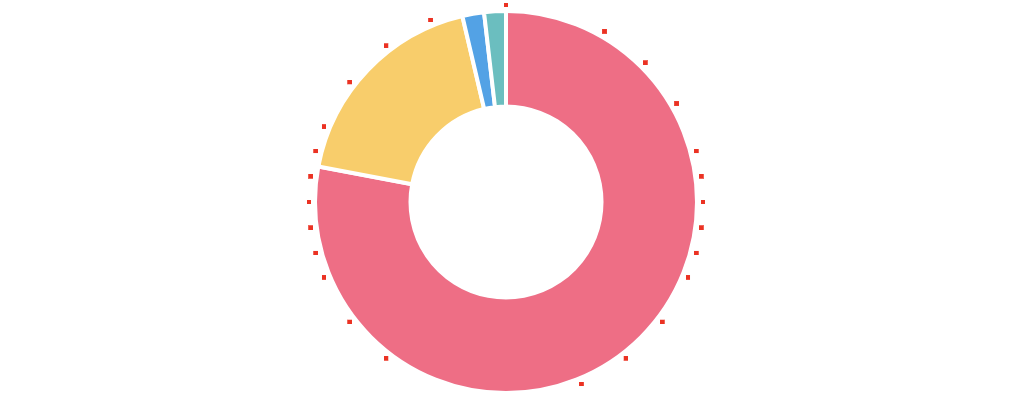
Here are some examples of it in action:

And here is a version with the labels positioned over two lines. Not as good, as the labels take up more space there are fewer points to choose from, but still usable.

I tried using it at work as a replacement for Chart.PieceLabel.js, and I’m pretty happy with the results. If you’re interested in seeing the code, it’s available on GitHub at chartjs-plugin-outerLabels.